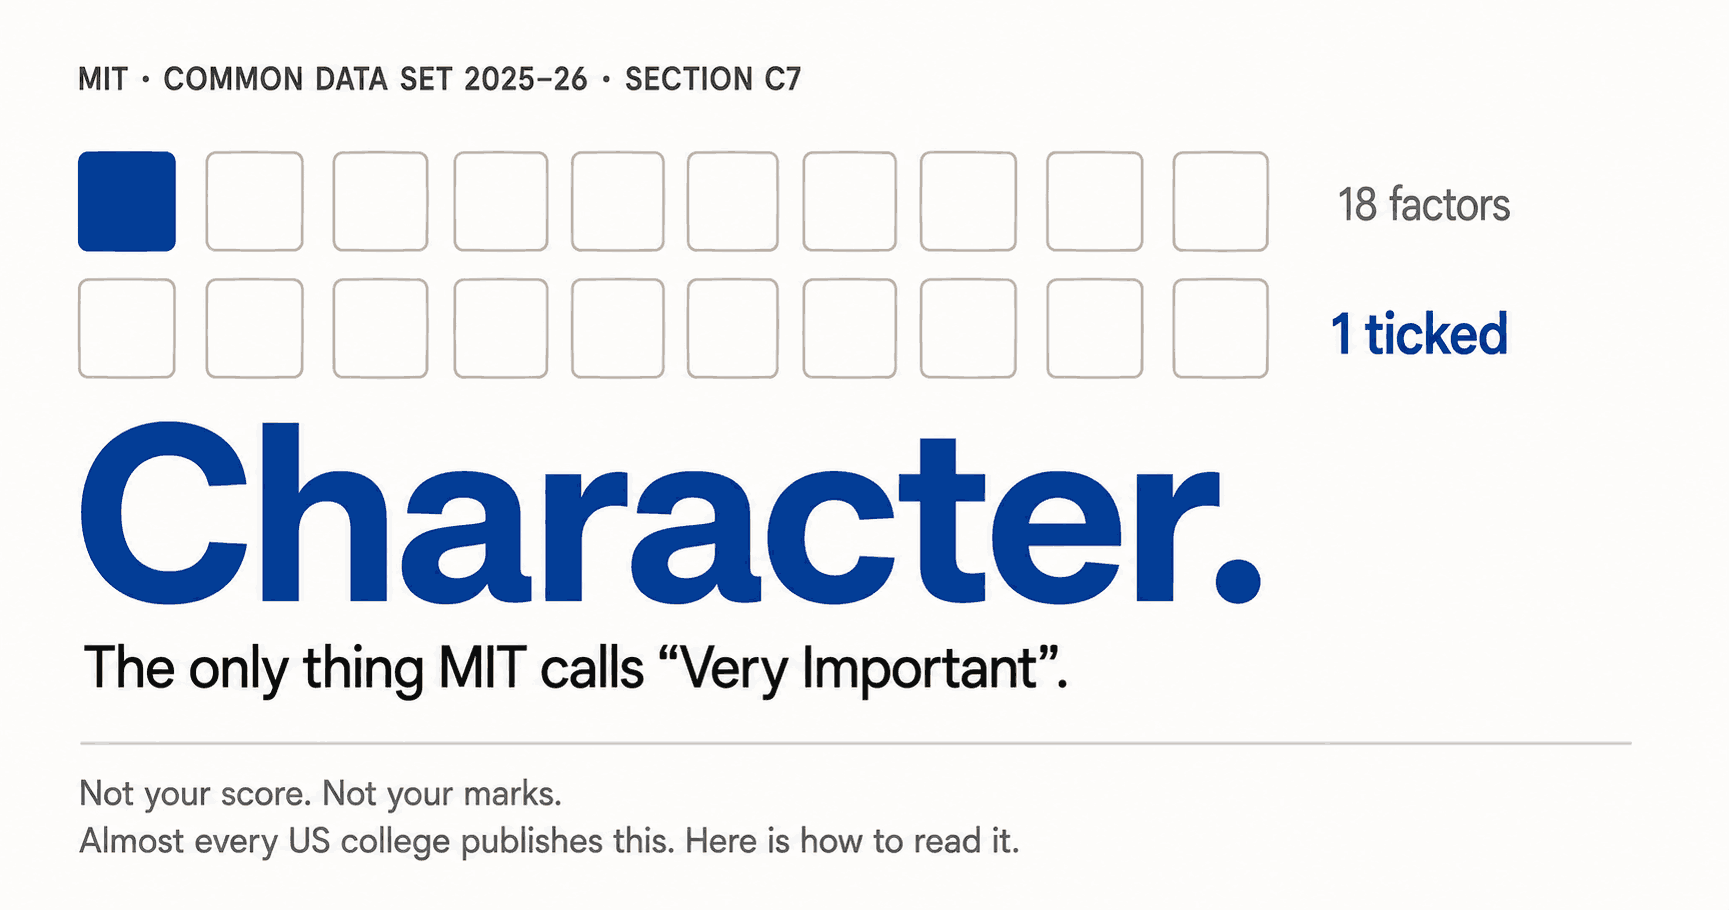
Eighteen things get rated. One is Very Important. It is not a number.
Method · Any US college·14 min read
What Colleges Really Want: How to Read a Common Data Set
Stop guessing what a college wants. Start with what the college tells you.
Published
The night before you start guessing
It is eleven at night. You have seventeen tabs open.
One is a Reddit thread from 2021. One is a video by a boy who got into Stanford and now sells a course. One is a consultant asking eighty thousand rupees to tell you what to do this summer. One is a chart of average SAT scores you have now stared at forty times.
Your mother is in the next room. She has asked you twice how it is going. You said fine.
You are trying to answer one question.
What do they actually want?
Now here is the strange part.
The college already published the answer. This year. For free. With its own name on it.
Nobody told you the file exists.
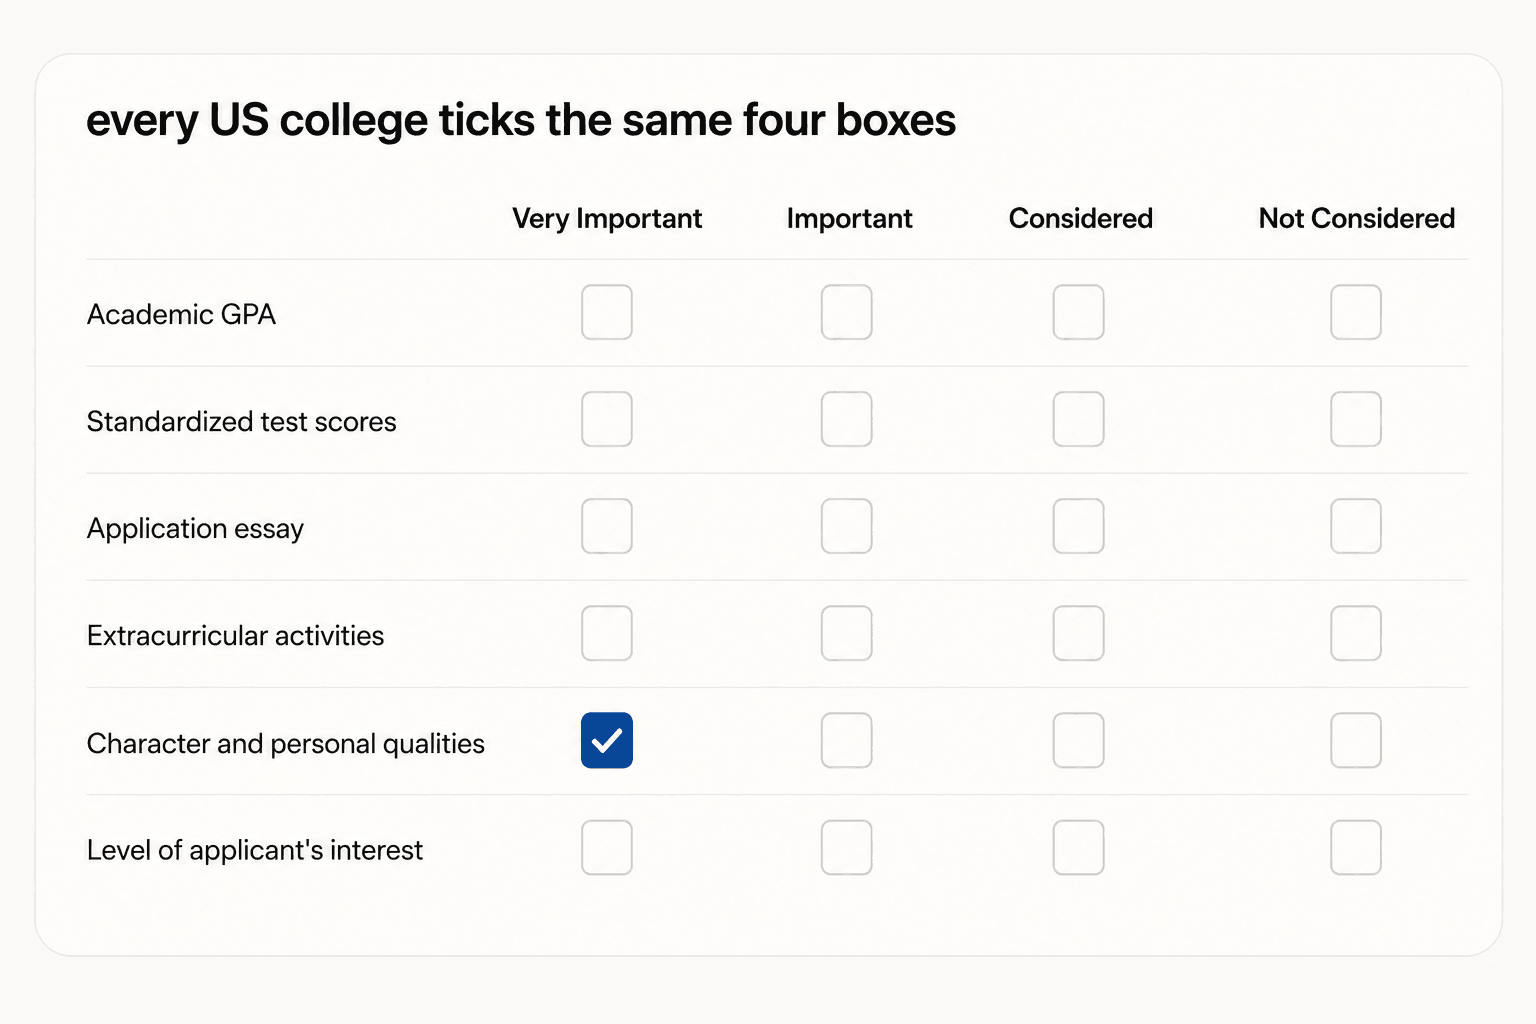
It is called the Common Data Set. Almost every US college fills one in. Same questions for every college. Same words. Same four boxes.
It is not an advertisement. It is their homework.
Close sixteen tabs. Keep one. This one.
One tick. Eighteen factors. This is MIT's answer, and it is public.
What you are actually holding
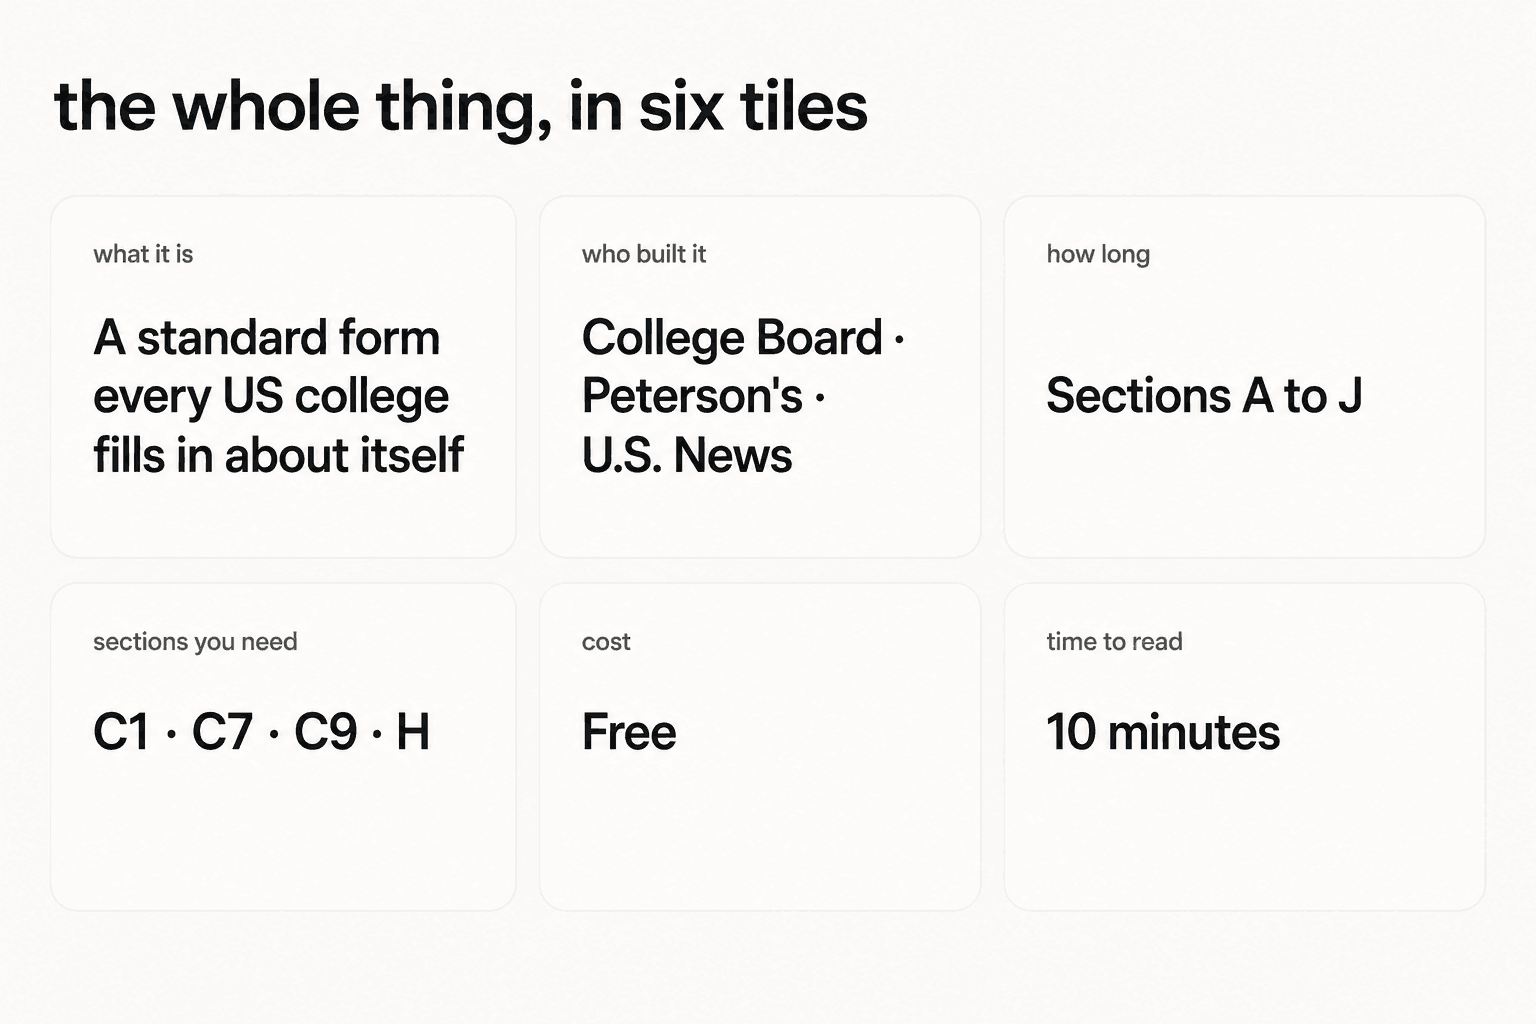
Before the four questions, thirty seconds on what this thing is.
Three publishers built it together. The College Board. Peterson's. U.S. News.
Before it existed, each of them sent colleges a different survey asking roughly the same things in different words. A college counted "class size" three ways for three publishers. Readers got three answers.
So they agreed on one set of questions. Every college answers the same ones, using the same meanings, every year.
Sections A to J. Ten of them.
You need four.
C1 tells you who applied and who got in.
C9 tells you what marks and scores they had.
C7 tells you what the college says it cares about.
H tells you what it pays for.
That is it. Four sections out of ten.
We are going to walk through MIT's file. Not because you want MIT. Because MIT publishes its file as a normal web page instead of a PDF, so you can open it on your phone right now and follow along with me.
By the end you will be able to do this to any college in an evening.
Four sections out of ten. That is the entire job.
Question one: how many people like me actually got in?
Open section C1. Three numbers.
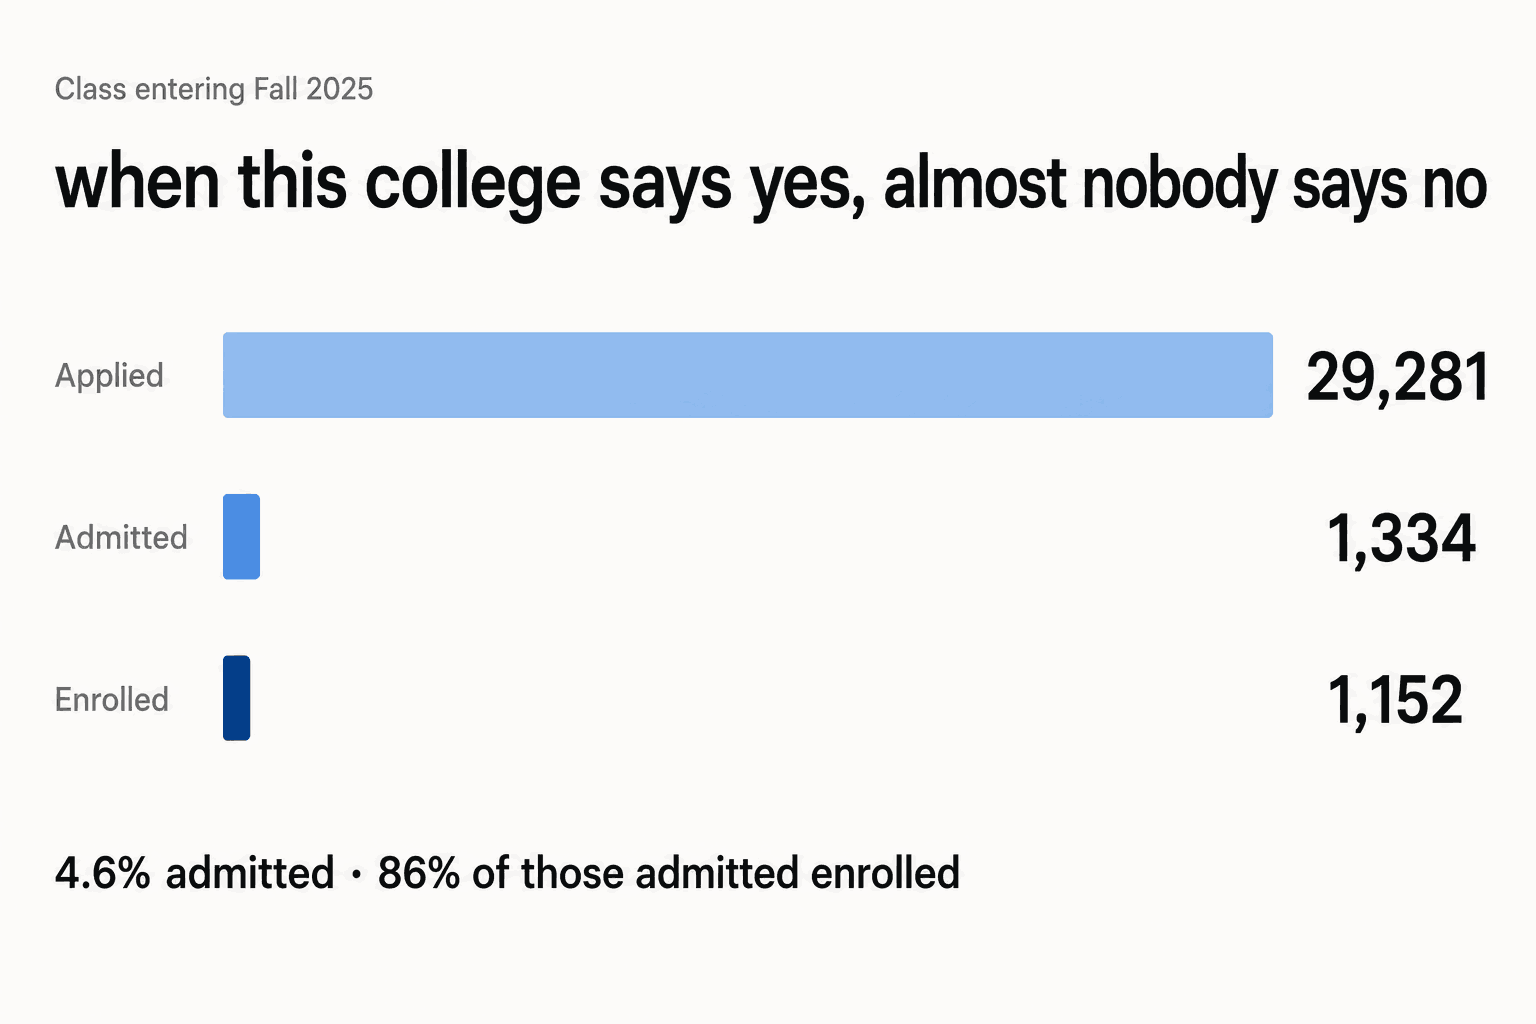
29,281 applied.
1,334 got in.
1,152 turned up in September.
That third number is the one nobody quotes, and it is the one that changes your plan.
Of the 1,334 students MIT said yes to, 1,152 said yes back. That is 86 out of every 100. When MIT offers a place, almost nobody turns it down.
The 4.6% is the number everyone quotes. The 86% is the number that tells you what the waitlist is worth.
Hold that thought and look at the waitlist, which is in the same section.
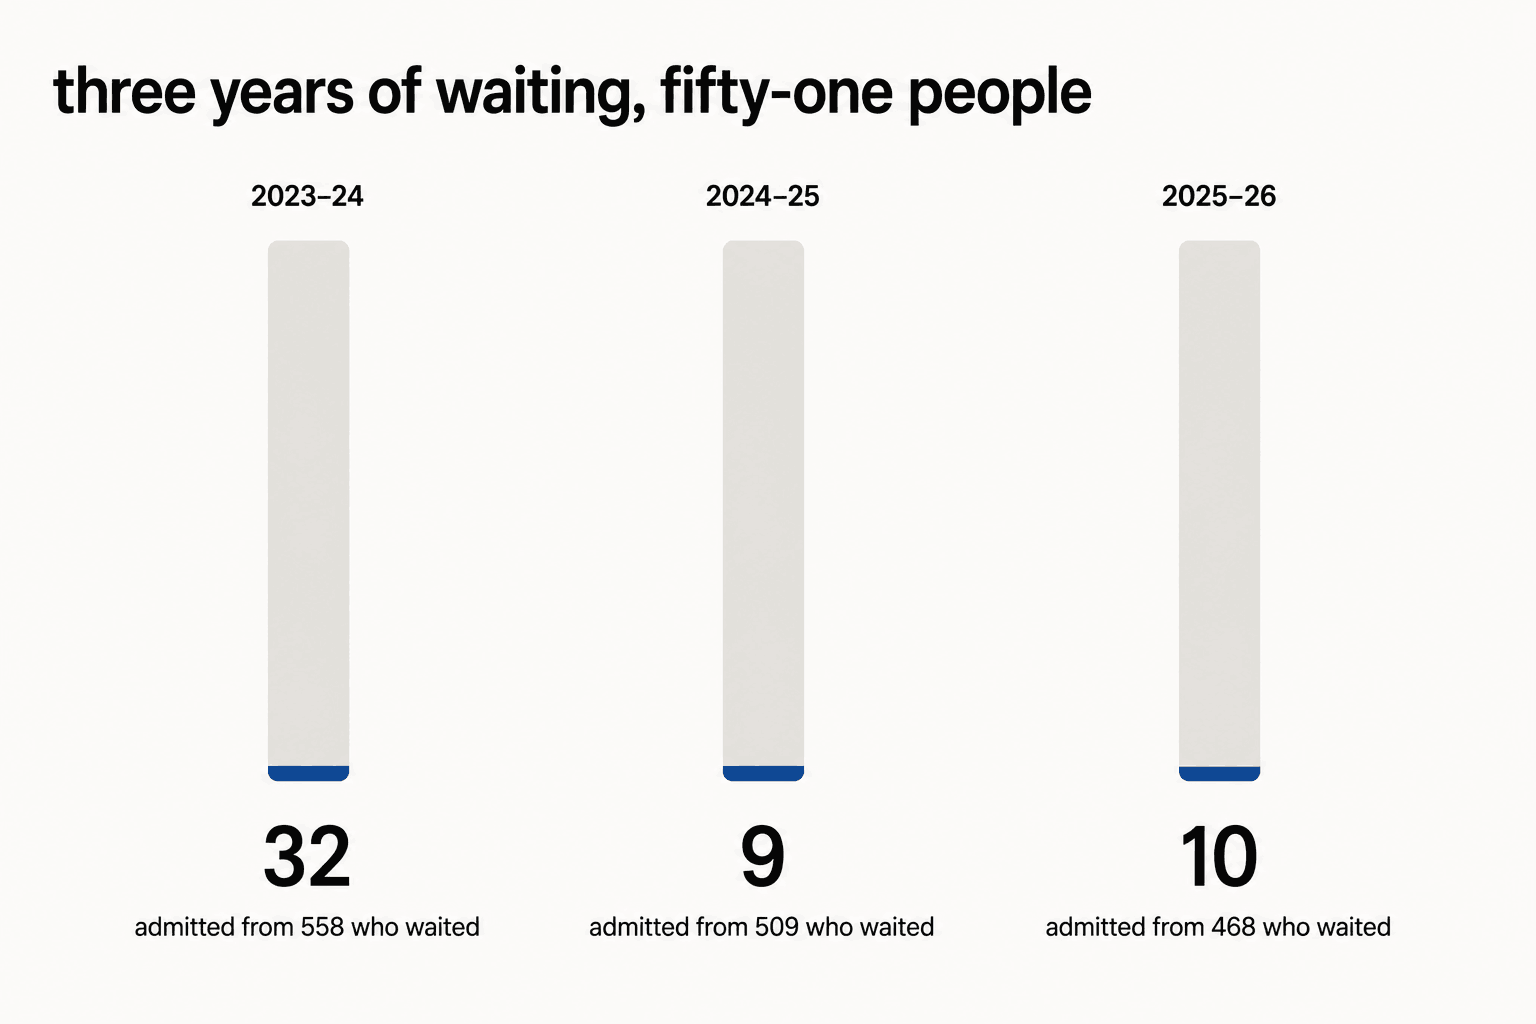
561 students were offered a place on the waiting list.
468 of them accepted the place and waited.
Ten got in.
Ten. Out of 468. That is two people out of every hundred who waited.
The year before it was nine out of 509. The year before that, thirty-two out of 558.
The number swung from 32 to 9 to 10 with nothing the students did.
Now put the two facts together, because this is the whole trick.
A college keeps a waitlist in case too few of its admitted students turn up. MIT's students always turn up. Eighty-six out of a hundred. So the waitlist almost never gets used.
Nothing those 468 students did in April changed that number. It moved from thirty-two to nine to ten because of how many other people said yes, not because of them.
What this means for you
Never read an acceptance rate on its own. Read it next to the yield. A low acceptance rate with a high yield means the college is somebody's first choice and its waitlist is a polite no. A low acceptance rate with a low yield means the people it admits are using it as a backup, and its waitlist is worth something.
One number describes the college. The other describes how the world feels about the college. Only the first one ever makes a headline.
Question two: is my score good enough?
You have a 1490. Somewhere in those seventeen tabs, someone told you MIT's range is 1520 to 1570.
So you did the arithmetic every student does at eleven at night. Thirty points short. Finished.
Read section C9 properly and that arithmetic falls apart.
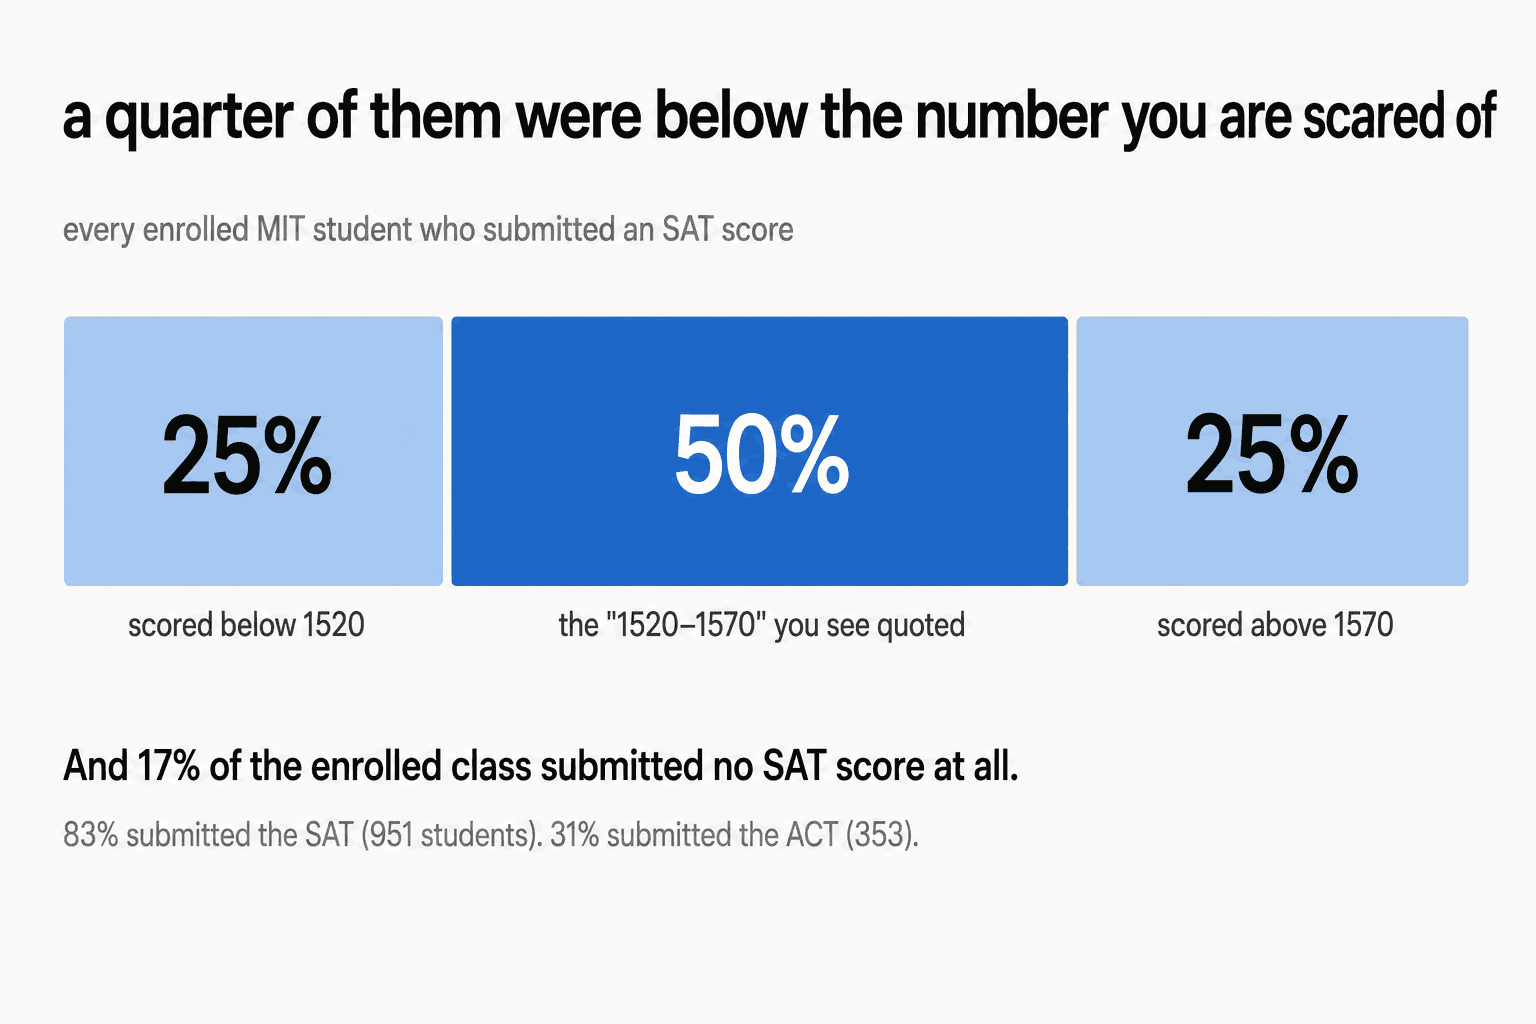
1520 to 1570 is the middle half. Not the bottom. The middle.
Which means a quarter of the students who enrolled scored below 1520.
Not a rounding error. A quarter. About 238 people.
They are on campus right now. They are in the labs. Nobody sat them down and told them they were under the range, because there is no range to be under.
Then it gets one step better.
That middle half is worked out only from students who sent a score in the first place. MIT's file says 83% submitted an SAT. That is 951 students.
But 1,152 students enrolled.
So the famous number, the one that made you do the arithmetic, describes 951 people out of a class of 1,152. About one in six of that class sent no SAT at all.
RMC Insight
Never look at the average. Look at the bottom of the range, then look at what share of the class even submitted a score. Two numbers, thirty seconds, and the cutoff you were scared of stops existing.
A score range describes people who were already chosen. It is not the rule that chose them. Reading it backwards is the most expensive mistake in the whole process, because it sends a family to buy another fifty points instead of building the thing that would have made the boy interesting. Those fifty points cost a summer. That summer was the asset.
The famous range describes 951 people out of a class of 1,152. It was never a rule, and it was never about you.
Question three: what do they actually want?
Section C7. This is the one that will change what you do tomorrow.
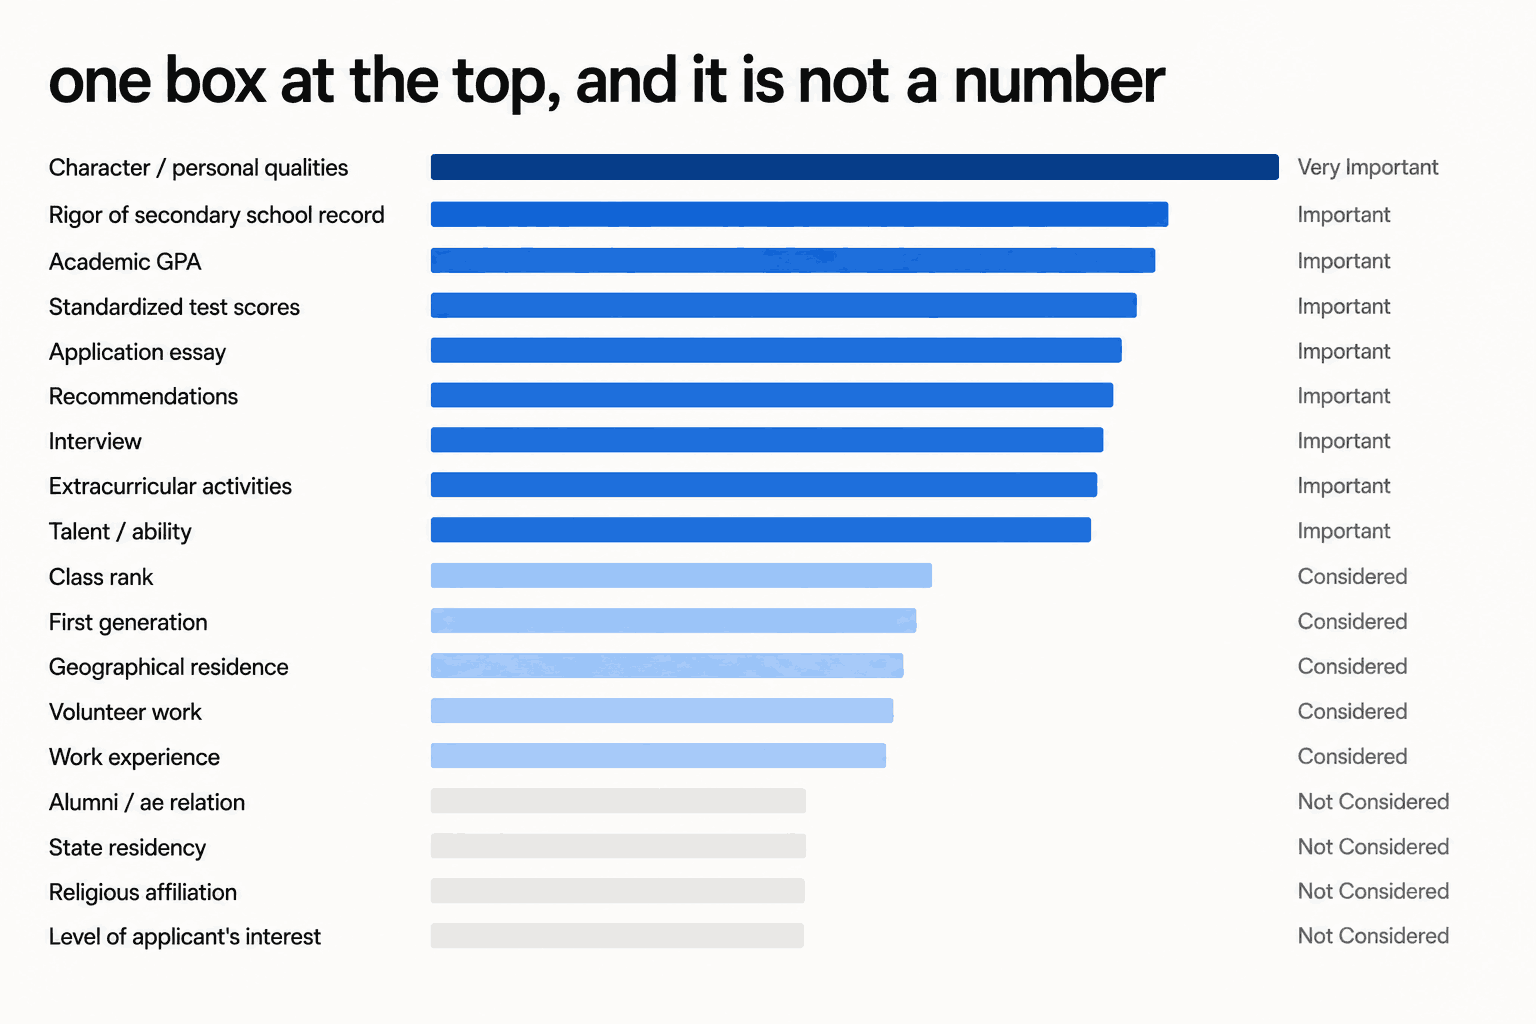
The form gives every college eighteen factors and four boxes. Very Important. Important. Considered. Not Considered. Every college ticks one box per factor.
Those four words have been on the form since at least 1999. Twenty-six years, unchanged. So when a college moves a factor from one box to another, that is a real event.
Here is MIT's answer. Every row, exactly as printed.
Four of these are printed as Not Considered. Somebody is still selling advice about all four.
Start at the bottom. This is the part nobody teaches, and it is the part that saves you the most time.
Four factors sit in Not Considered.
Alumni relation. Your uncle studied there? Not in the file.
Level of applicant's interest. Opening their emails does not help. Attending the webinar does not help. The whole "show them you love them" game does not exist here.
State residency. Religious affiliation.
Four things people will charge you to worry about, and MIT has printed in public, every year, that it does not look at them.
Now go to the top.
Eighteen factors. One box ticked in the top column.
Character and personal qualities.
Not marks. Not test scores. Not how hard your school subjects were. All three of those sit one row down, in Important, next to the essay, the interview, your activities and your teachers' letters.
Read that again with MIT in your head.
MIT. The place with more brilliant maths people per square metre than anywhere on earth. The college whose applicants spend four years polishing numbers.
It ticks one box at the top, and it is not a number.
And this is not a one-year accident.
Year
Rated Very Important
Test scores
2023–24
Character / personal qualities
Important
2024–25
Character / personal qualities
Important
2025–26
Character / personal qualities
Important
Three years. Same one box.
Now, the thing nobody says out loud.
There is no character section on the application. There is no box you tick. There is no certificate for it.
Character is not something you send. It is something a stranger works out from everything else you sent.
Which means the top of MIT's form is not an instruction. It is a warning. Everything you can control is being read for something you cannot hand over directly.
What this means for you
Read every C7 table from the bottom up. The bottom tells you what to stop doing this week, which is worth more to you right now than knowing what to start.
Why a form tells the truth when a brochure does not
Stop for a second, because a fair question is forming.
Why would a college write any of this down?
Everything above tells you what the file says. This part is about whether you can believe it. We leave MIT for two minutes, then come straight back.
It did not write it for you. That is the answer, and it is the whole reason the file works.
A brochure is written to win you over. A form is written to be filed.
The Common Data Set exists because publishers were sending colleges three different surveys and colleges were tired of filling in three different forms. Its own stated purpose is to "reduce the reporting burden on data providers."
You are reading someone else's paperwork. Nobody was trying to persuade you when they wrote it.
Four things follow from that, and together they are why this file is more reliable than anything else you will read tonight.
They cannot pick the questions. Everyone answers the same ones. A college that would rather not discuss its waitlist still has to fill in the waitlist boxes.
They cannot pick the words. Four fixed tiers. It cannot write "we take a holistic view of the whole student." It has to tick a box.
It repeats every year. Which means you can put two years side by side and catch a change. Almost nobody does this, and it is free.
Their name is on it. Which brings us to the one time somebody checked, at a different college.
In 2022 a maths professor at Columbia called Michael Thaddeus went through his own university's numbers. Columbia had just been ranked the second best college in America.
Columbia claimed 82.5% of its classes had under twenty students. Thaddeus counted them himself and got closer to 63%. Columbia claimed 100% of its teachers held the top degree in their field. He did not believe that either.
He put his working online in February.
By July, U.S. News had stripped Columbia of its rank.
By September, Columbia admitted it. The real class size figure was 57%. The real teacher figure was 95.3%.
In 2025, it paid nine million dollars to settle a case brought by its own students.
And here is the detail that matters to you.
Columbia had never published a Common Data Set in its history. It published its first one that same September.
The remedy for getting caught was this file.
So the two colleges in this article are doing two different jobs, and it is worth being clear about which is which.
MIT shows you what the file says. Its answers are unusually blunt and its tables are unusually easy to read.
Columbia shows you why the file is worth reading. It never published one. It said whatever it liked instead. Then one man sat down and counted, and it lost its rank, its good name and nine million dollars.
You need both. A table you have no reason to trust is just numbers. A scandal with no table is just a story.
RMC Insight
When you want to know what an organisation really does, never read the thing it wrote because it wanted to. Read the thing it filled in because it had to. That rule is worth more than this article. It works on colleges, on companies you might join one day, and on anybody selling you something at eleven at night.
Back to MIT, and to the question your mother is actually asking.
Question four: can we afford it?
This is the question your mother is actually asking when she asks how it is going.
Most families answer it by looking at the fee on the website, going quiet, and quietly removing the college from the list.
Section H is where you find out whether that was right.
MIT's file, section by section.
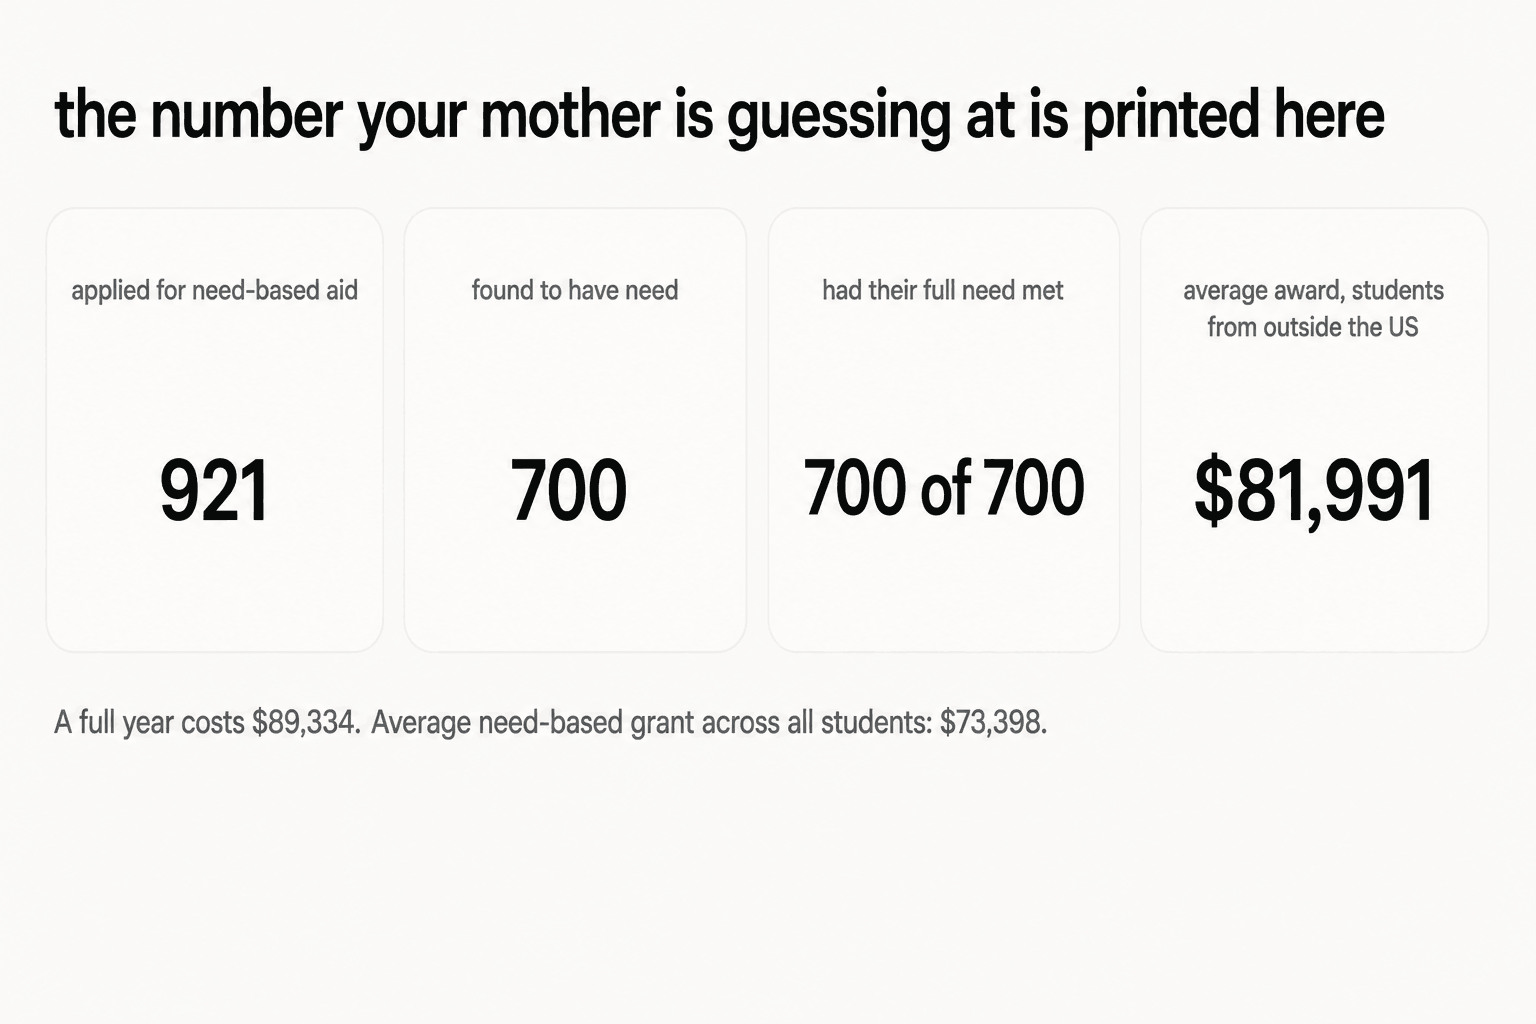
921 first-year students applied for need-based aid.
700 were found to have real financial need.
700 had that need fully met. All of them. Not most.
The average grant was $73,398.
Now the number nobody expects. For students from outside the US, the average institutional award was $81,991.
A full year at MIT, tuition plus fees plus food and housing, costs $89,334.
Read those two numbers together. That is the whole point of section H.
None of this is a promise. Aid depends on your family's finances, and it varies enormously between colleges. Plenty of US colleges give international students nothing at all, and their files say so, in the same section, in the same place.
Which is exactly why you look it up instead of guessing.
What this means for you
Before you remove a college because of the fee, open section H. Find how many students had full need met, and find whether aid to international students is listed separately. Two numbers. The sticker price is almost never the price.
"We cannot afford it" is a guess. Section H is not.
Most colleges are nothing like MIT
Everything you have just read is about one very strange college. Now step back, because the wide view is the calmest thing in this article and almost nobody prints it.
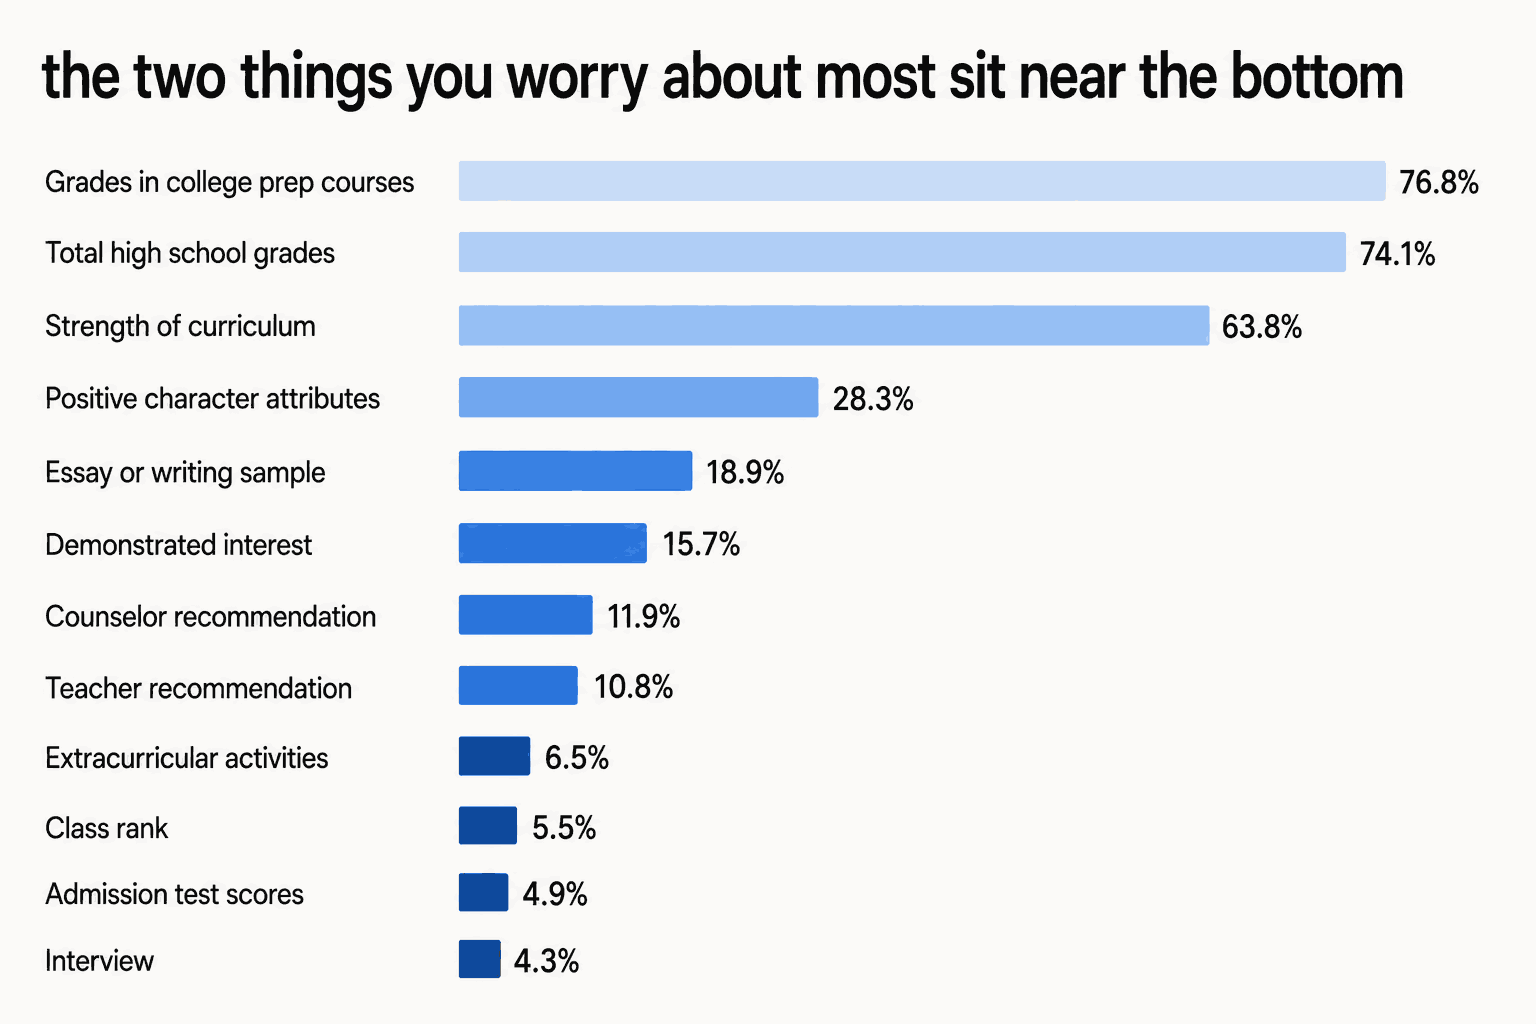
Every few years a body called NACAC asks colleges across America which factors carry "considerable importance." The newest public figures cover 185 four-year colleges.
Grades in college prep courses: 76.8%.
Strength of curriculum: 63.8%.
Extracurricular activities: 6.5%.
Admission test scores: 4.9%.
Read the last two again.
Across American colleges, the two things that eat the most of your worry, your parents' money and your weekends are called highly important by fewer than one college in fourteen.
Test scores have fallen off a cliff. In 2018 about 46% of colleges called them highly important. By 2023, about 5%.
The boring answer has not moved at all. Take hard subjects. Do well in them.
RMC Insight
A whole industry is built on that 6.5%. Summer programmes, olympiad coaching, journals that publish a student paper for a fee, "research internships" sold by the week. Nearly all of it is priced against the handful of colleges where activities decide the case, then sold to the enormous number of families applying somewhere else. Ten minutes with a Common Data Set tells you which of those two situations you are in.
Fewer than one college in fourteen calls activities or test scores highly important. Marks do almost all the work.
Now do it yourself, on a college nobody wrote an article about
This is the part that makes the last hour worth something.
Pick a college on your list that is not famous. One nobody makes YouTube videos about.
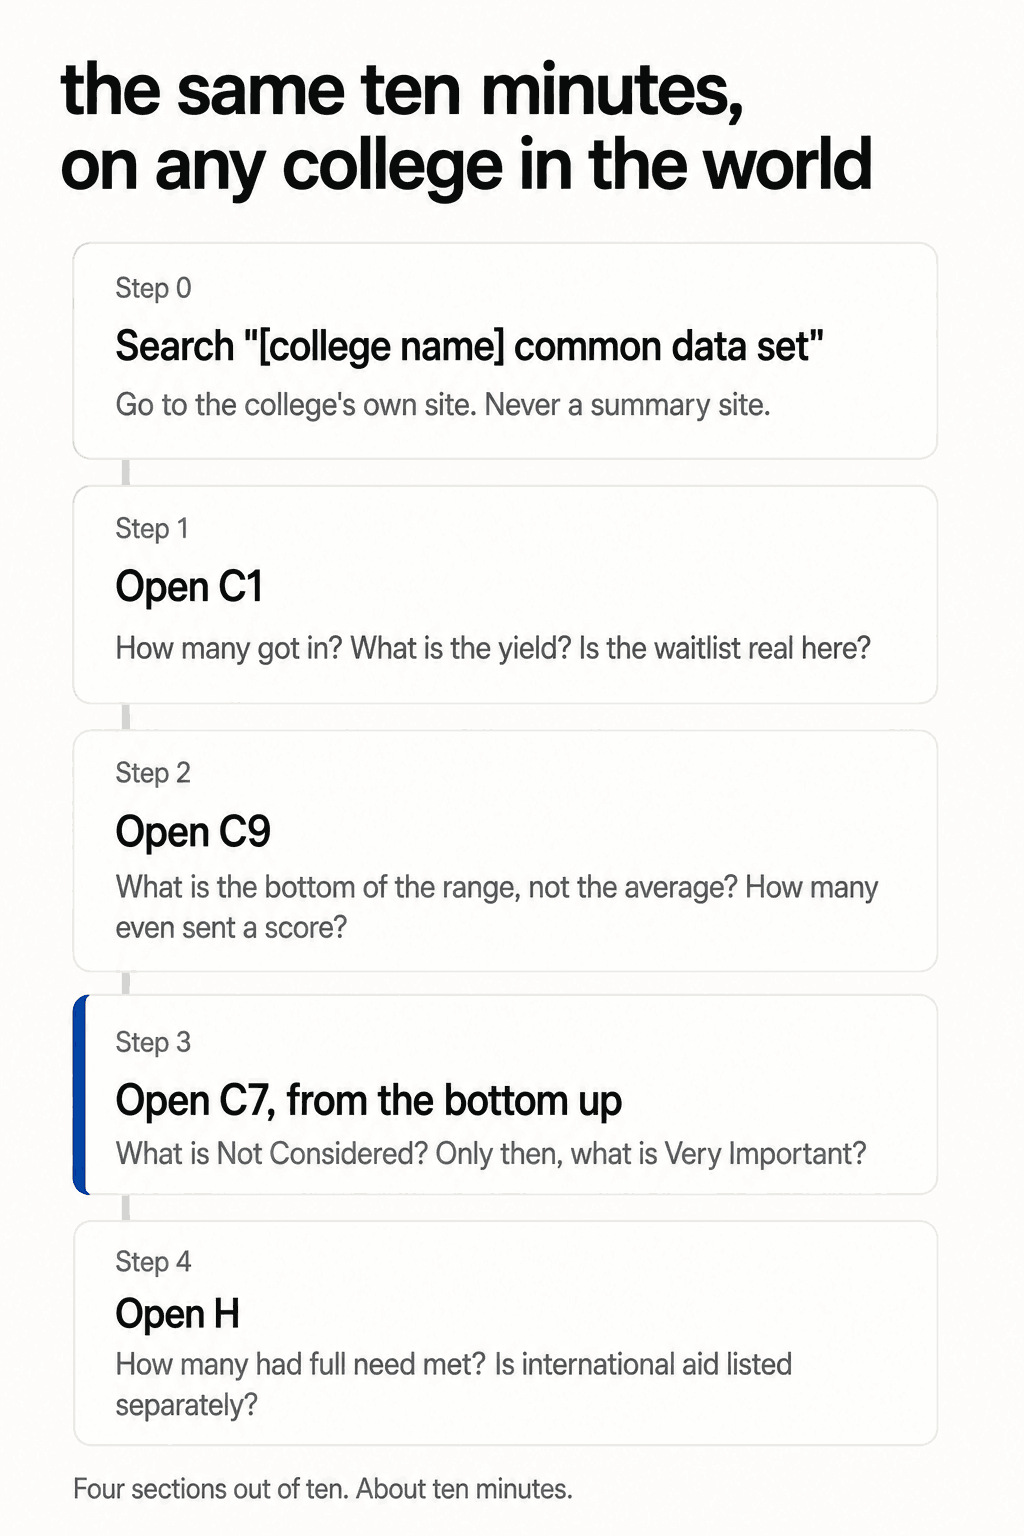
Search: [college name] common data set
Go to the college's own site. Usually a page called institutional research, or planning, or the registrar. Not a summary site. Summary sites are fine for orientation and wrong often enough that you should never quote one.
Then work the four questions.
C1. How many applied, got in, turned up? What is the yield? What is the waitlist really doing here?
C9. What is the bottom of the range, not the average? What share even sent a score?
C7. Start at the bottom. What is Not Considered? Then the top. What is Very Important?
H. How many had full need met? Is aid to international students listed separately?
Four sections. Ten minutes. And you will know more about that college than the boy in the video knows about Stanford.
Step three is the one that changes what you do tomorrow. Read it upwards.
Three warnings before you go
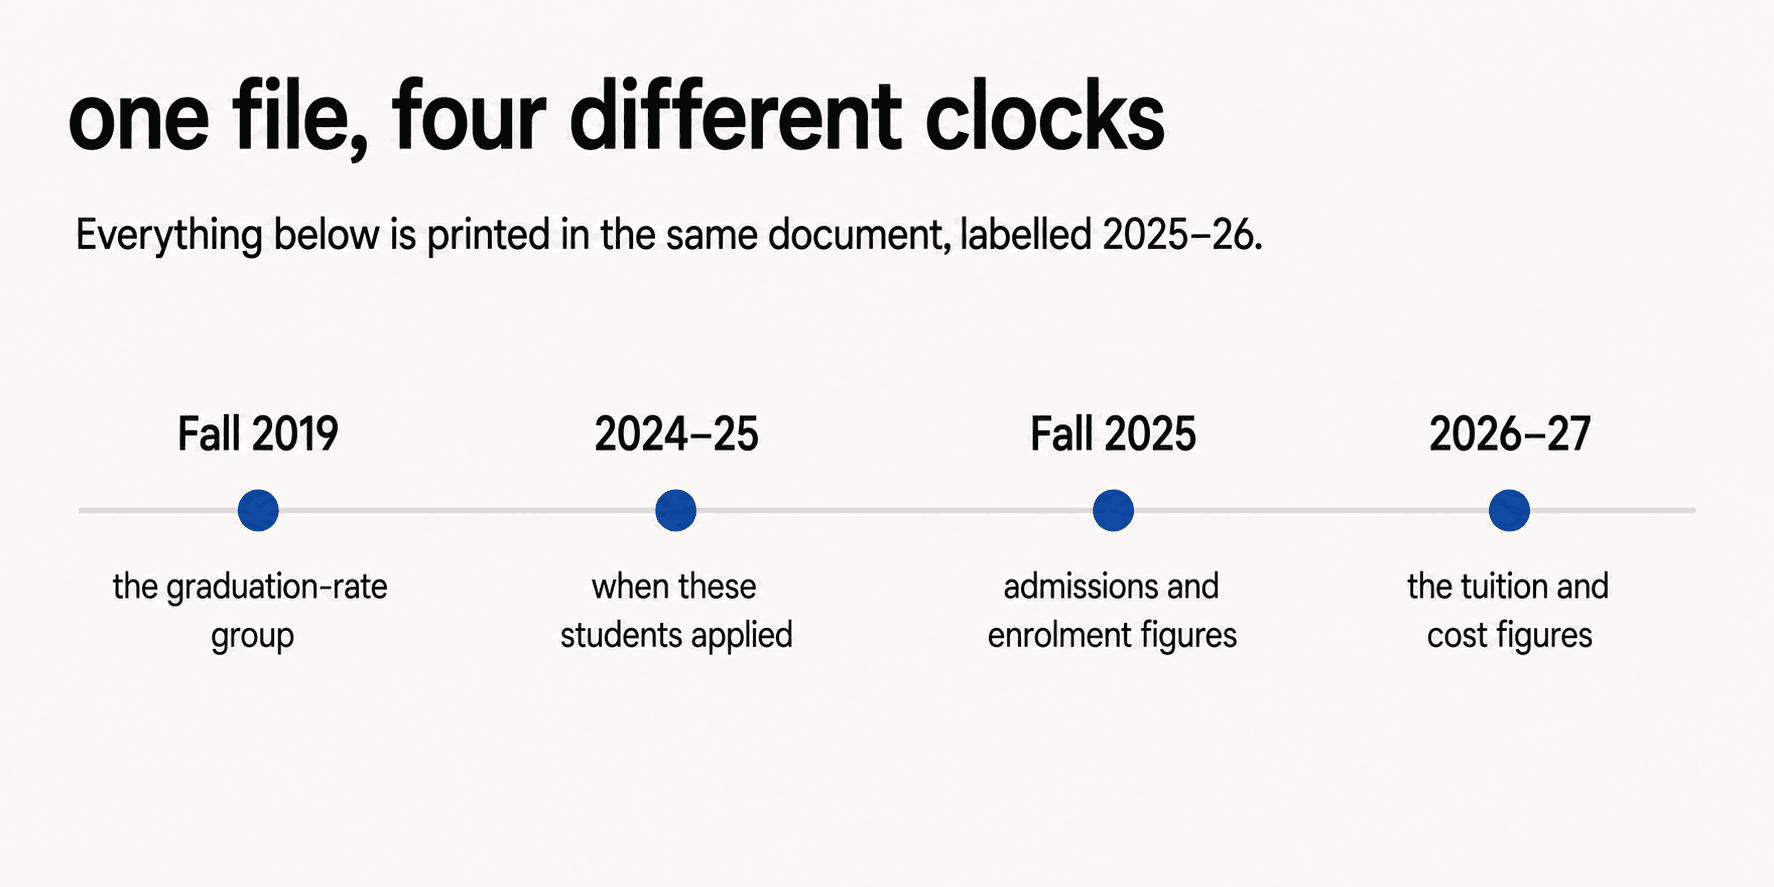
Check the year, then subtract. A file marked 2025-26 describes the class that started in autumn 2025. They applied the year before that. You are reading decisions taken about eighteen months ago. Worse, one file deliberately mixes periods. Admissions figures look back to autumn 2025, tuition looks forward to 2026-27, and graduation rates cover people who started six years earlier. None of that is a trick. It is what the form asks for. It only misleads the reader who assumes one date.
Expect a PDF, and expect a fight. Most colleges post a scanned or exported PDF, and C7's tick boxes very often lose their column alignment when a computer converts them to text. Copy a C7 table out of a PDF, or ask an AI to read one, and you can get a confident answer that is completely wrong. Read that table with your eyes.
Not every college publishes one. It is entirely voluntary. No law, no regulator, no penalty. Nobody has ever published a reliable count of how many US colleges post one, so any article telling you "nearly all of them" is guessing. Columbia never published one until it got caught. If a college on your list has no file, that proves nothing on its own. But it is a small, free, real fact about how that college treats the public.
None of this is a trick. It only misleads the reader who assumes one date.
What this actually changes for you
Go back to your own file for a moment.
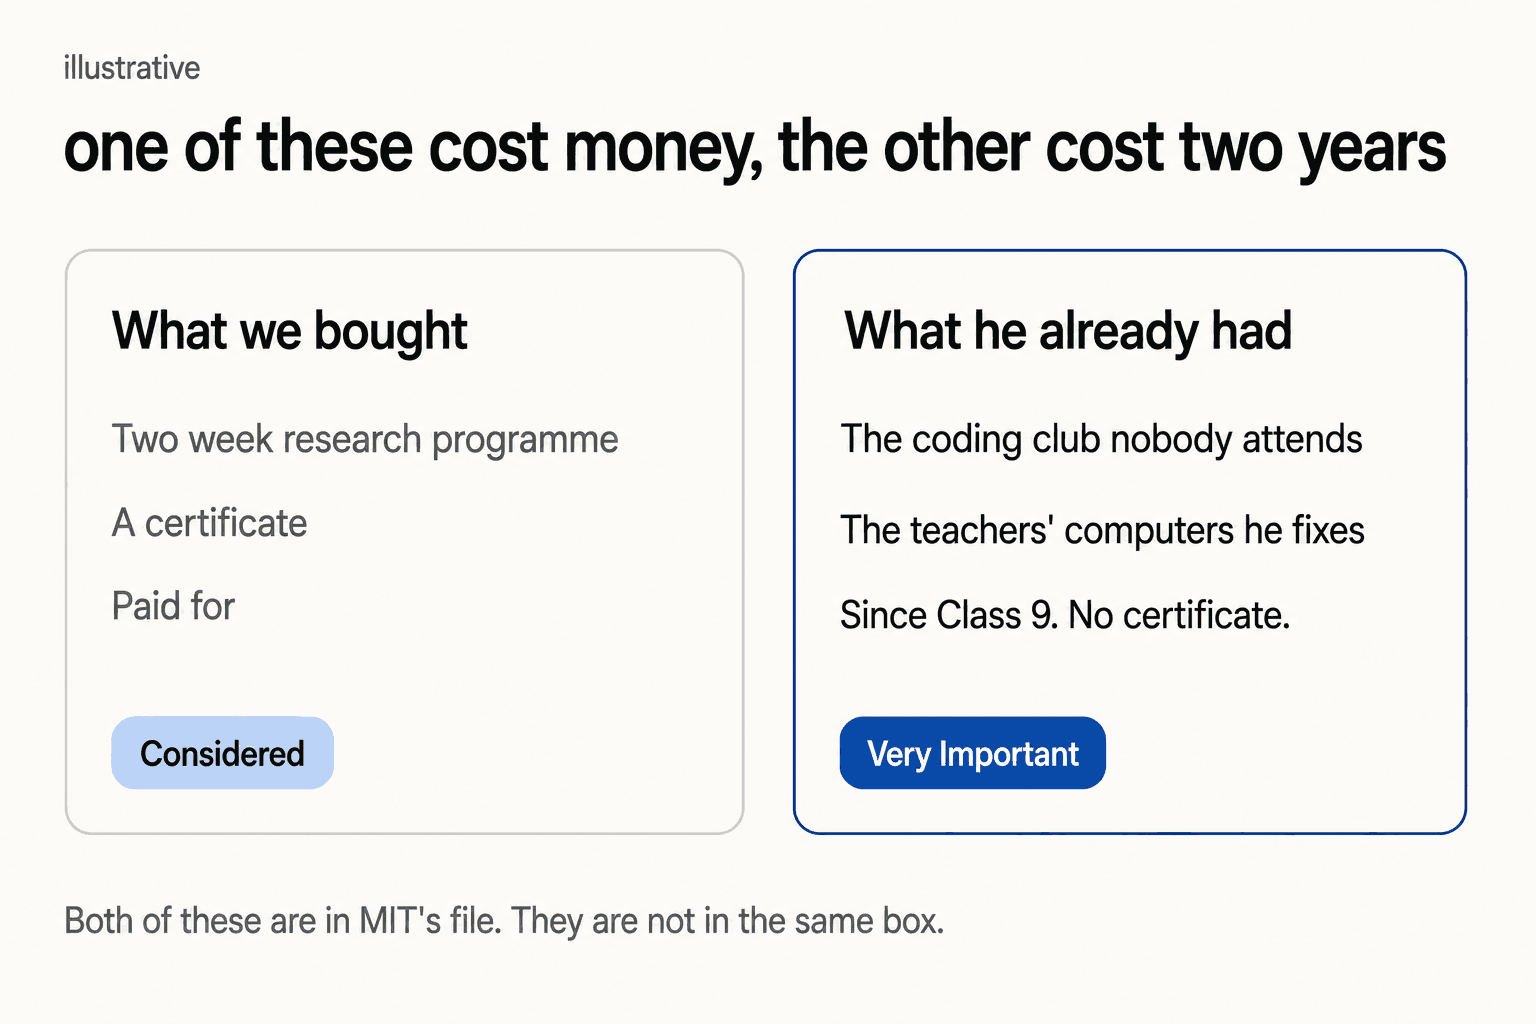
Say you spent last summer on a research programme your parents paid for. Two weeks. A certificate at the end. It felt like the responsible thing to buy.
And say there is something else. The thing you have been doing quietly since Class 9 that you never counted, because nobody sells a certificate for it. The coding club nobody attends. The computers you fix for the teachers. The thing your mother thinks is a distraction.
Open C7 again.
The paid programme is aimed at a box marked Considered.
The quiet thing, the one you stayed with for two years and never got credit for, is the only evidence you own that speaks to the box marked Very Important.
Nobody can read character off a certificate. They read it off what you stayed with when nothing was counting.
That is not a nice thought. It is what the form says.
Nobody can read character off a certificate. They read it off what you stayed with when nothing was counting.
RMC Insight
The most missed quality in an application is not strength. It is whether it rings true. A reader spending a few minutes with your file is not scoring you, they are deciding whether they believe you. Every extra unconnected item is one more thing that has to fit the story, and one more chance for the file to read as assembled rather than lived.
The things you are afraid to ask
Look at C7 again. Geographical residence sits in Considered at MIT, and first generation sits there too. The file does not reward a famous school. It rewards evidence that holds together.
You have just done, for free, the thing many consultants charge for. The file is public. Their access to it is exactly the same as yours.
Read C7 with your eyes, on a laptop, zoomed in. It is one table. It takes two minutes.
Then use IPEDS, which is a US government database and is not optional for any college taking federal student aid. You will lose C7, which is the best part. You will keep the admissions and cost numbers.
Every rule in this article is about where to point your remaining time. Finding out in Class 11 that four factors are Not Considered gives you back the hours you were about to spend on them.
Stop guessing
You do not have to become an admissions expert. You do not have to remember a single number in this article.
You have to know where the evidence lives.
Because guessing is expensive.
You can spend two years preparing for a college without ever reading how it judges people.
You can spend a fortune on test prep for a college that puts test scores one row below character.
You can collect activities because a video told you top colleges like leadership, and then apply to a college that has printed, in public, every year, that it does not look at your level of interest at all.
Or you can spend ten minutes with a form.
A form is a dull thing. A form filled in under fixed rules, published under a college's own name, every single year, is not dull at all. It is the closest thing to a college speaking plainly that you are ever going to get.
Michael Thaddeus found a national scandal in one.
You are only looking for a table.
It is still eleven at night. You still have seventeen tabs open.
Close sixteen of them.
Stop guessing what a college wants. Read what it already put in writing.
The Common Data Set will not tell you whether you get in. It tells you where to apply, what to build, and what to stop paying for.
Which leaves the one question a form cannot answer.
Does your evidence look like what they said they wanted?
Does your evidence match what they said they wanted?
That is the question RateMyChance was built to answer. The assessment is free, it takes a few minutes, and it tells you where your profile actually stands right now.
What this page does not claim. There is no reliable published count of how many US colleges post a Common Data Set, so this page does not give one. Publication is voluntary, and a college that publishes nothing is not doing anything against a rule.
MIT figures are from the Common Data Set 2025-26, describing the class that entered in autumn 2025, the most recent complete cycle. Last checked 14 August 2026.
RateMyChance is independent. We are not affiliated with MIT, Columbia, Harvard or any university named here, and nothing on this page is a promise of admission. Every figure is taken from the institution's own published Common Data Set or from the sources listed above, and every one is dated. Where a college publishes nothing, we say so rather than estimate.